Entering 2024, concerns about inflation and recession are starting to subside, with growth projected to return to normal in line with pre-pandemic trends. This is a sign of optimism that the market will rise again. In 2024, CRIF estimates that economic growth will be in the range of 4.80% (yoy) to 5.20% (yoy). The projected lowest growth range is weakening below the 5% level due to the global economic slowdown trend due to the geopolitical situation, inflation and still high interest rates. High credit interest rates in Indonesia have contributed to the slowdown in economic growth, in line with increasing operational costs for business players.
The sector with the largest GDP contribution (leading sector) will again be dominated by the processing industry, agriculture, trade, mining and construction sectors, where each of these sectors is projected to control >10% of the distribution portion in GDP in 2024. The manufacturing sector will also continue to be in expansive level, while the transportation and warehousing accommodation-food and drink sector will be the sector with the fastest growth rate. The tourism sector is predicted to be able to realize the target of contributing 4.5% of national GDP in line with the increasing mobility of domestic and foreign tourist visits.
Inflation in 2024 is expected to be maintained at around 3.0%, while the Rupiah exchange rate against USD in 2024 will be in the range of 15,100-15,600 per USD. The strengthening projection is based on estimates of controlled inflation and BI monetary policy in 2024 to focus on pro-stability. However, the higher for longer trend that will last until mid-2024 still allows the exchange rate to erode to above IDR 15,500.
APBN realization is a significant driver for economic growth in 2024. However, investment and export performance in 2024 will not be good due to weakening investment realization in the political year, declining development of Indonesian exports, slowing trade performance and falling prices of Indonesia's leading commodities on the global market. Through the appropriate allocation of funds to strategic sectors, the APBN can be an important instrument for triggering investment, increasing productivity and creating jobs.
A number of challenges and economic conditions faced include a total saving factor (gross savings) of only 39% of GDP, and total capital market capitalization of only 49% of GDP. With a high Investment Capital Output Ratio (ICOR) of 7.6 (2023), economic growth far beyond 5% will not be achieved. If the growth target is 6%, then an investment to GDP ratio of around 36% is needed.
Taking into account the conditions of the national leadership transition process next year, foreign investment cannot be expected to be a driver of increased economic growth because investors tend to wait and see when making investment decisions in the political year. CRIF also assesses that the election will indeed be a driving force for consumption and economic growth in 2024. However, its implementation needs to be maintained to ensure political and economic stability, so that the democratic party does not have the potential for disputes over election results and conflict. Historically, in the last 4 political contest cycles (2004, 2009, 2014 and 2019) real GDP growth was lower before the election and higher after the election.
GDP Growth during Election Year
|
General election |
Months |
Quarter |
During |
-2Q |
-1Q |
+1Q |
+2Q |
Key Event |
|
2004 |
Jul-Sep |
3 |
5,47% |
4,89% |
5,17% |
8,36% |
6,86% |
Commodity Boom |
|
2009 |
Jul |
3 |
4,57% |
5,00% |
4,54% |
5,92% |
6,25% |
GFC |
|
2014 |
Jul |
3 |
4,93% |
5,54% |
4,94% |
5,05% |
4,83% |
Post-Taper Tantrum |
|
2019 |
Apr |
2 |
5,05% |
5,28% |
5,06% |
5,01% |
4,96% |
US-China Trade War & Covid |
Source: Statistics Indonesia
Apart from actors waiting for clarity around candidacies and programs, we also need to consider external macro events that also influence output dynamics. For example, in 2004, Indonesia was still facing a commodity boom, in 2009 after the global financial crisis, in 2014 after the taper tantrum, and in 2019 it was overshadowed by the US-China trade war and the start of the Covid pandemic. Overall, we maintain a conservative view that the narrative of increased consumption will most likely be offset by 'wait and see' actions taken by corporations until the program becomes clearer, especially regarding the continuity of the national development program promoted by President Jokowi.
Which sector to focus on?
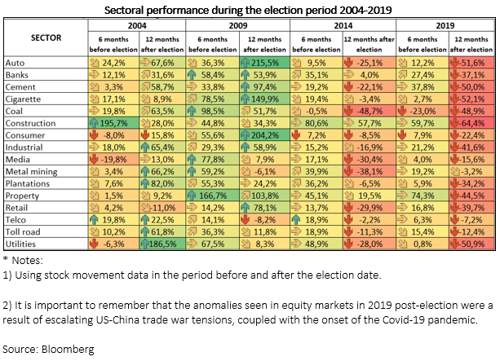
As campaigns begin, candidates will learn the specifics of their plans and programs, potentially influencing market sentiment based on what each competitor has to offer. Historically, elections can affect a variety of industries, and in the Indonesian context, certain industries may thrive as a result of increased campaign activity and the implementation of more populist policies. The consumer and cigarette sectors often experience increases as political campaigns stimulate economic activity, resulting in higher consumer spending. Investors often develop strategies to take advantage of these opportunities as election-related developments develop.
However, it is important to note that the specific impact on sectors may vary based on the policies and promises made by the candidates, as well as broader economic conditions.
In fact, the consumer staples sector emerged as one of the best performing sectors after the elections (12 months after the 2004 & 2009 elections) along with the automotive, banking, property and utilities sectors. We also understand that certain factors during the period helped these sectors to achieve better performance; therefore, it is important to examine patterns while considering these factors. For example, banks, property and toll road operators may experience the negative impact of favorable interest rates in the lead up to an election.
Automotive
The government plans to expand the Electric Vehicle (EV) incentive program, especially in relation to the 2-wheeled vehicle segment. The incentive of IDR 7 million/unit for new units and conversions from conventional to electric will continue at least until the end of 2024. Accommodative policies such as fiscal incentives, elimination of import duties and tax incentives will also be implemented to accelerate the development of the domestic EV ecosystem. After implementing a state income tax policy of 1% for domestic purchases of electric vehicles, the government is now considering requiring a tax-free policy for fully built-up (CBU) imported electric vehicles. At the same time, the government also pushed for factories to be built domestically, similar to Thailand's strategy, which allowed them to successfully increase production levels to 10% from 2%.
Indonesia's automotive industry is a large sector, where transportation equipment contributed 3.6% of GDP and 3.73% of national exports in 2021. This country is the largest car market in Southeast Asia, and the second largest production base after Thailand. Domestic annual growth in four-wheeled (4W) and two-wheeled (2W) vehicles in the last five years has ranged from 5.1% to 5.3%. Official records show 17 million 4W and 121 million 2W passenger cars in 2021.
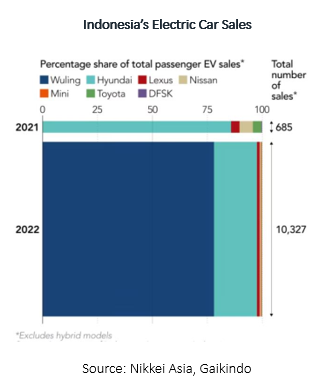
Astra International also actively supports the introduction of electric vehicle products, considering that Toyota controls >50% of the Indonesian automotive market share. This plan will lead to increasingly fierce competition amidst the entry of Chinese and South Korean players into the Indonesian market. However, due to the uniqueness of the Indonesian market, car manufacturers need to consider after-sales service as a strategy to win domestic customers. Currently the domestic electric vehicle market is dominated by Hyundai and Wuling products, which will control ~51% and ~34% respectively in September 2023, and if Astra International has the opportunity to excel, it will do so by "disrupting" hegemony these two products.
The obstacle faced by electric vehicles is that the supply of semiconductors is hampered by China. Recently, China banned the export of gallium and germanium, potentially impacting industries that require semiconductors as part of their production lines. This is because gallium and germanium are one of the semiconductor components commonly used in electric vehicles, and ~60% and ~90% of germanium and gallium respectively are sourced from China. A country that wants to buy gallium and germanium from China requires that country to pass China's national security inspection, so its distribution policy is already strict. With this regulation, there will be the potential for an increase in the price of the metal due to the possibility that the supply chain will experience obstacles, be it a decrease in production and/or logistics.
Banking
The World Bank has cut its 2024 economic growth forecast for China and warned that developing countries in East Asia will grow at the lowest rate in five decades, as United States (US) protectionism and rising debt hamper the economy. The World Bank projects China's economy to grow only 4.4% in 2024, from its previous projection of 4.8%. The impact is a decrease in global trade volume so that the rate of world economic growth slows down. Heavy pressure is also still facing the global economy, such as the global inflation rate which has not yet returned to pre-pandemic levels so that global benchmark interest rates remain higher for longer.
The various global challenges seen have caused Bank Indonesia (BI) to take preventive steps by increasing the BI 7-Day Reverse Repo Rate (BI7DRR) by 0.25% to 6%. This policy was taken after previously BI7DRR was at the level of 5.75% since January 2023 or maintained for eight consecutive months.
In the 2024 RAPBN, the government estimates that economic growth will reach the level of 5.2% from this year's level of 5.3%. Meanwhile, BI estimates that Indonesia's economic growth in 2024 will be in the range of 4.7% - 5.5% from this year's estimate of 4.5% - 5.3%.
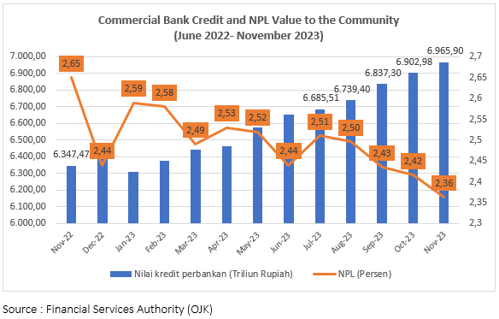
The Financial Services Authority (OJK) reported that the value of commercial bank credit disbursement to third parties or the public reached IDR 6,965 trillion or IDR 6.96 quadrillion in November 2023. This figure grew 7.76% on an annual basis (year-on-year/yoy) compared to November 2022 worth IDR 6,347 trillion.
This figure also increased 0.91% on a monthly basis (month-on-month/mom) from the previous record of IDR 6,902 trillion in October 2023. The credit value in November 2023 was recorded as the highest in the past year.
On the one hand, nonperforming loans (NPL) or bad credit in November 2023 was recorded at 2.36%. This figure is much lower than November 2022 which reached 2.65%. Meanwhile, the highest NPL in a year's period was recorded in January 2023, which reached 2.59%.
Cement
Domestic cement demand in July 2023 has succeeded in growing. Referring to data from the Indonesian Cement Association, cement use in July 2023 will reach 5.8 million tons. This number increased by 9.7% monthly and grew 12.6% annually.
Bulk cement sales grew by 19.3% on an annual basis, aka year on year (yoy). The largest growth contribution from Kalimantan was driven by the implementation of the Archipelago National Capital Development (IKN) project in this region.
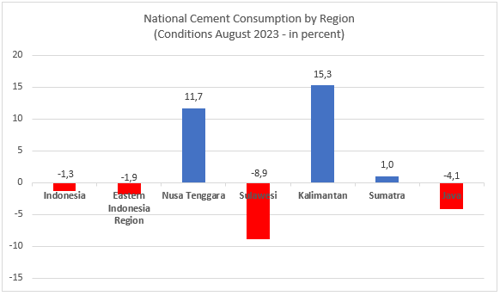
Meanwhile, sales of bagged cement grew by 10.2% annually, supported by growth in sales from outside Java. But cumulatively, cement sales from January to July 2023 reached 33.2 million tons, still down 2.3% yoy.
Although there is a potential increase in volume, taking into account the risks that may occur in the future, we estimate that sales volume will remain stable in 2024. Risks faced by cement industry players include 1) geopolitical risks associated with further depreciation of USD/IDR, leading to increased energy costs; 2) the possibility of extending the selection period, delaying the project completion time; 3) higher rainfall intensity after El-Nino.
Mining
In 2023, gold has outperformed other competitors in the metal category. This is supported by high geopolitical uncertainty, as well as strong demand from central banks in their efforts to increase gold reserves. According to the World Gold Council, central banks around the world have added around 800 tonnes of gold throughout 2023, a new record, 14% more than in 2022. During Q3 alone, China's central bank acquired a total of 78 tonnes of safe haven assets due to the ongoing economic turmoil. continues, followed by Poland (57 tonnes), Turkey (39 tonnes and India (9 tonnes). Middle East escalation, Black Sea instability and the risk of Russian-style sanctions by US and European hegemony amidst an overarching theme of economic instability have made bank central has become an avid gold buyer, coinciding with huge price movements since the Covid-19 pandemic (a total of 1,136 tonnes purchased in 2022, (up from 450 tonnes in 2021).
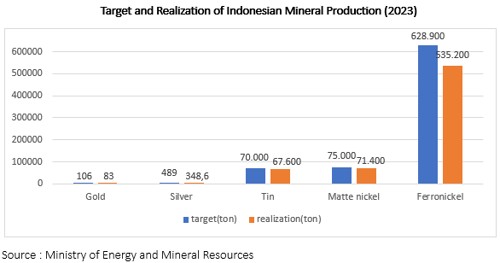
According to the Directorate General of Mineral and Coal (Ditjen Minerba) of the Ministry of Energy and Mineral Resources, the realization of domestic mineral commodity production did not reach the target in 2023. This happened to the commodities gold, silver, tin and nickel (matte nickel and ferronickel). Throughout 2023, Indonesia's actual gold production will only be 83 tons from the target of 106 tons. Then silver production was 348.6 tons from the target of 489 tons, and tin production was 67.6 thousand tons from the target of 70 thousand tons. Next there was matte nickel with production of 71.4 thousand tons from the target of 75 thousand tons, and ferronickel production of 535.2 thousand tons from the target of 628.9 thousand tons.
Furthermore, nickel is one of the metals whose performance was sluggish in 2023, because it experienced a contraction of around 45% and a large surplus situation as a result of aggressive production (up 54% YoY). This oversupply is reinforced by a 36% YoY increase in China's Class I nickel production, and is expected to continue to increase as downstream efforts through a combination of Chinese technology and Indonesian reserves have enabled production of intermediate products such as mixed hydroxide precipitates and NPI to matte nickel to increase. The fate of the basic metals industry may not necessarily produce good results in 2024.
Copper is expected to be at the level of USD8,500/ton throughout 2024. The risk of surplus will occur in 2024, because the international forecast study group (ICSG) estimates that the refined copper market will reach an excess supply of 467 thousand tons. But in the long term, copper is expected to remain on the rise as it plays an important role in the global green transition, being used in everything from electric vehicles to turbines and power grids, offsetting further losses if the market relies solely on conventional channels such as the property sector.
Coal
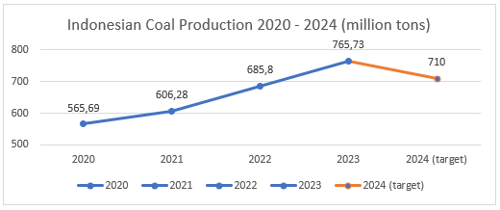
In the midst of the green energy trend, the Ministry of Energy and Mineral Resources (ESDM) has raised its national coal production target this year to 710 million tons. This target is an increase from the 2023 production target of 694.50 million tons. However, when compared with the realization of coal production in 2023, this target remains lower because referring to Minerba One Data Indonesia (MODI), production reaches 765.73 million tons.
It is projected that coal prices will still have difficulty rising in 2024. Since the end of 2022, coal prices have fallen by 46.13% from USD 262.95 per metric ton. World coal prices are highly dependent on demand from China and India. These two countries do more domestic production. Apart from being the largest consumer, China is one of the world's largest coal producing countries. Coal is expected to trade at USD 150 per metric ton in early 2024.
Oil and Gas
The decline in oil prices due to monetary policy was offset by OPEC countries' production and geopolitical tensions. World oil prices experienced high volatility due to tightening monetary policy and production cuts from OPEC. OPEC production cuts and geopolitical tensions helped raise crude oil prices to USD96.7/bbl on September 23, but increased production from the United States and non-OPEC countries offset the increase.
The war between Israel and Palestine presents two possibilities for crude oil prices; in the first scenario, if the war spreads to Lebanon and Syria, oil prices could rise to around USD90/bbl. The worst-case scenario for this conflict is direct war between Israel and Iran. If this happens, oil prices could rise above USD140/bbl and hamper economic growth.
The economic contraction also contributed to the decline in natural gas prices. In 2023, natural gas prices experienced a significant decline of -19.4% YTD to reach the level of USD3.1/MMBTU. This downward trend was mainly caused by slowing global economic growth and the low dependence of European countries on natural gas also had an impact on this decline. However, the conflict between Israel and Palestine caused a +35% spike in natural gas prices since October 23 due to supply disruptions due to the closure of large natural gas production facilities in Israel. For 2024, Indonesia is targeting Indonesian Crude Oil Prices (ICP) to be at USD82/bbl (vs USD with a target of 635,000 BOPD (vs 660,000 BOPD in 2023).
Copyright © CRIF Indonesia. 2024
Disclaimer: This publication is provided for information purposes only and is not intended as investment advice, legal advice or as a recommendation as to particular transactions, investments or strategies to any reader. Readers must make their own independent decisions, commercial or otherwise, regarding the information provided. While we have made every attempt to ensure that the information contained in this publication has been obtained from reliable sources, CRIF Indonesia is not responsible for any errors or omissions, or for the results obtained from the use of this information. All information in this publication is provided ’as is’, with no guarantee of completeness, accuracy, timeliness or of the results obtained from its use, and without warranty of any kind, express or implied. In no event will CRIF Indonesia, its related partnerships or corporations, or the partners, agents or employees thereof, be liable to you or anyone else for any decision made or action taken in reliance on the information in this publication or for any loss of opportunity, loss of profit, loss of production, loss of business or indirect losses, special or similar damages of any kind, even if advised of the possibility of such losses or damages.